
 TablePlus
 SwitchResX
 Swinsian
 SwiftServer - Monitoring & SSH
 Sweet Home
 Techtool Pro
 Tenorshare UltData
 Termius

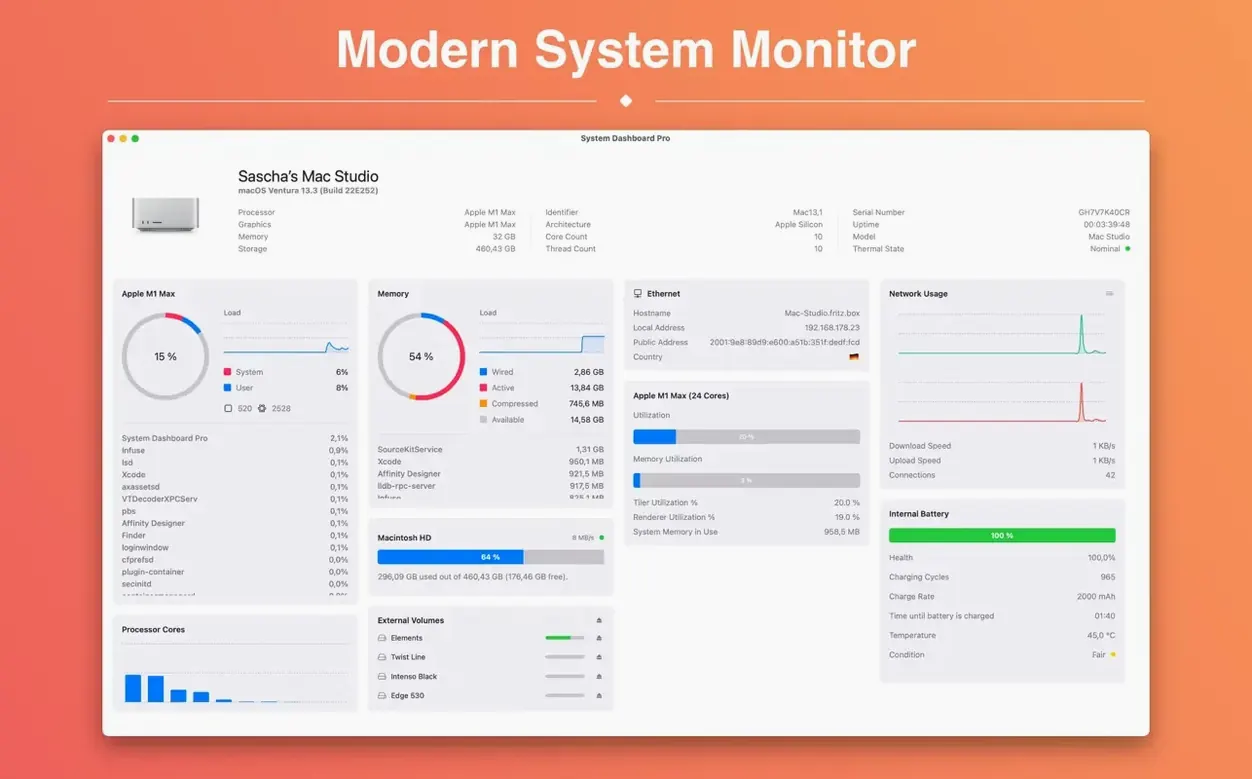
Battery cycle count is one of those numbers you don't think about until a MacBook gets warm on your lap. System Dashboard Pro puts it right in the menu bar, next to the battery condition. It's a quiet, unblinking reading—just the data, no alerts.
What makes it worth a spot on a busy Mac is the depth behind each panel. The network pane, for example, doesn't stop at upload and download speed. It surfaces your local and external IP addresses, WLAN transfer speed, and a live count of open connections. If you're tracking down what's phoning home, that connection counter is faster than opening Activity Monitor.
The CPU pane shows current load plus a graph of the last few seconds, so you can catch spikes as they happen. Disk speed gets its own live readout, which is handy when you're copying large media files and want to see if the drive is keeping up. On Intel and Apple Silicon Macs alike, the panels stay light and responsive.
A blank temperature panel is the most common hiccup. On Apple Silicon Macs, the app needs permission to read sensor data. Head to Privacy & Security in System Settings and make sure System Dashboard Pro has access. A relaunch after toggling that usually brings the readings back.
If download and upload speeds freeze at zero, it's often a VPN or firewall app getting in the way. Pause the VPN for a moment and the network pane snaps back to life. For fan speed readings that seem stuck, a cold restart of the Mac sorts it—the sensor daemon occasionally loses its thread after a long sleep.
On an M2 MacBook Air, the app sips around 0.2% CPU while the window is closed and the menu bar icon ticks along. Open all five panels at once and it barely nudges past 1%. Memory use hovers under 80 MB—light enough that you forget it's running until you glance at the menu bar.
Live graphs refresh at what feels like a 1-second interval. Disk speed readouts update fast enough to catch dips during a large file transfer, and the CPU history graph is smooth without jitter. No panel redraws stutter, even with other heavy apps working in the foreground.
System Dashboard Pro sits comfortably next to Activity Monitor rather than trying to replace it. The battery cycle count and condition line up with what you'd find in System Information, just faster to reach. Network readings mirror nettop output without the terminal scroll.
Drag the menu bar widget next to the clock and you get a one-glance summary of CPU and memory. It respects macOS focus modes—no pop-ups during Do Not Disturb. If you use Shortcuts, you can tie a quick action to open the full system dashboard pro mac full version window, though that's a power-user move most people won't need.
The temperature and fan panels pair well with third-party fan control utilities, giving you raw numbers while the other tool adjusts curves. Disk speed readings are a solid cross-check when benchmarking external drives with Blackmagic Disk Speed Test.
The open-connections counter in the network pane is per-protocol, not per-app. It won't tell you Safari specifically has 23 tabs calling home, but it gives a fast total that helps spot runaway background processes.
It displays current download and upload speed, local and external IP addresses, WLAN transfer speed, and the number of open connections.
System Dashboard Pro requires macOS 15.6 or later and runs on both Apple Silicon and Intel 64-bit Macs.













Chat 0
Hop in or make an account to join the chat.
Quiet in here so far. If you have used this build, tell me what the install actually did.